
Traditional Earned Value Management Processes
Full research paper could be found by clicking this link below:
http://www.pmroi.com/storage/WuS_TEVMAEVMProcess_20110620-pmroiweb.pdf
Su-Cheng Wu

3.0 Traditional Earned Value Management Process and Tools Overview:
3.1 Traditional Earned Value Management Application:
3.1.1 T-EVM benefit and Success Criteria
The traditional earned value management is one of the most effective tools in managing project scope, time, and cost. It calculates cost and schedule variances, and derives performance indices from measuring actual cost against actual progress on planned value earned. [5] (Rusk, 2011) The performance trend is then used to a) forecast project cost and schedule at completion and b) signal possible need for corrective actions. [4] (Anbari, 2003) In short, traditional earned value is “a project management technique to measure, at a specific date, the progress and performance of a project against the plan, provide corrective actions and to estimate future performance.” [3] (Cabri and Griffith, 2006)
T-EVM’s key success criteria are:
a) The quality of the baseline plan,
b) Actual performance tracked closely to the up-to-date and approved (re-)baseline plan, and
c) Taking corrective actions based on the appropriate assumption about future performances (see the various EAC formulas, Table 1). [4] (Anbari, 2003), [9] (Goodpasture, 2010), [19] (Larson and Gray, 2011), [20] (Kanabar and Warburton, 2008).
3.1.2 T-EVM Standard Metrics, Definition and Equation Summary
Table 1:

3.1.3 EVM Limitations and the Importance of an objective “% Complete”
EVM has no native “quality”-related metrics, and therefore cannot measure quality “objectively”. Under EVM, project can be “on time” and “under budget” yet still be considered a failure if project does not satisfy certain stakeholder’s quality requirement. This issue is shared with Agile EVM. To measure ROI based on “quality” delivered, not “effort” delivered, Dan Rawsthorne had suggested assigning “Business Value” to the WBS. In short, “Business Value” is a subjectively weighted value to be measured as “Earned Business Value” using his EBVM formula. Nevertheless, the key word here is “subjective value”. “Assigning [Business Value] is not a technical matter and should be handled by either business or customer with the single stipulation that the weights be additive. Beyond that, there is no prescriptive formula or requirements” [10] (Rawsthorne, 2010). “Business Value” is different from the “Scope Points” Booker had suggested, since “Scope Points”, like Agile’s “Story Points”, measure the “size” of the scope, which usually relate to “ideal effort”. As Rawsthorne had pointed out and similar to EVM’s limit, one cannot assume that “more” effort delivered always equate to “more” business value delivered. Why is this important? It demonstrates one key concept: In order to preserve EVM’s strength, one should calculate Earned Value “objectively”, not “subjectively”.
3.1.3 T-EVM Proposed Best Practice: The Importance of an objective “% Complete”
As demonstrated so far, EVM’s main strength is in its ability to use effort-based planned, actual, and estimated performance metrics to forecast Cost and Schedule at Completion. Since “Earned Business Value (EBV)” is not a native EVM index and depends on subjective assignment of business value, keeping earned value (EV) as objective as possible is important and one must be careful not to confuse the two. This would require an objective definition of the “% Complete” since “EV = (% Complete) x (Planned Budget)”. Often, a team would assign a non-objective “% complete” based on qualitative assessments in the calculation of Earned Value. This practice not only confuses “Earned Business Value” with “Earned Value”, it also severely diminishes EVM’s strength to “objectively” forecast Cost and Schedule at Completion. To objectively determine the “% complete”, the following factors should be considered: Actual Start Date, Baseline Effort, Actual Effort, and Estimated Remaining Effort. Using the formula: “% Complete” = “(Actual Effort Spent to date) / (Baseline Effort + Estimated Remaining Effort)” then yields an objective % complete, which in turn results in the most objective EV, CPI, SPI, ETC and EAC forecast results. The proposed “% complete” definition is in line with the PCIC Index listed in Table 1 above, factoring in actual cost and relies less on subjectivity. [19] (Larson and Gray, 2011)
3.2 T-EVM Charts
3.2.1 Purpose and Benefits
The purpose of Earned Value burn charts is to serve as a reporting tool. It clearly displays AC, PV, EV and other selected project KPIs, enabling project evaluation at a glance. These charts show the Earned Value KPIs as records in a time phased trend and are useful as an overall project health diagnostic tool for immediate corrective actions, which is important for satisfying the third T-EVM Key Success Criterion. [3] (Cabri and Griffith, 2006)
3.2.2 T-EVM Chart 1: Burn Up Chart
The first traditional Earned Value Chart (Chart 3.2.2) is a classic Burn Up chart. The chart can show whether a project is on track by allowing the viewer to compare the project’s AC and EV to date, in comparison with PV, BAC in time, with the ability to also show CV and SV. Moreover, EAC can be forecasted based on which EAC formula was chosen.
Chart 3.2.2: Shows a challenged project; AC is higher than projected; EV is lower than projected, resulting in (-CV),(-SV) and a dangerously high EAC.
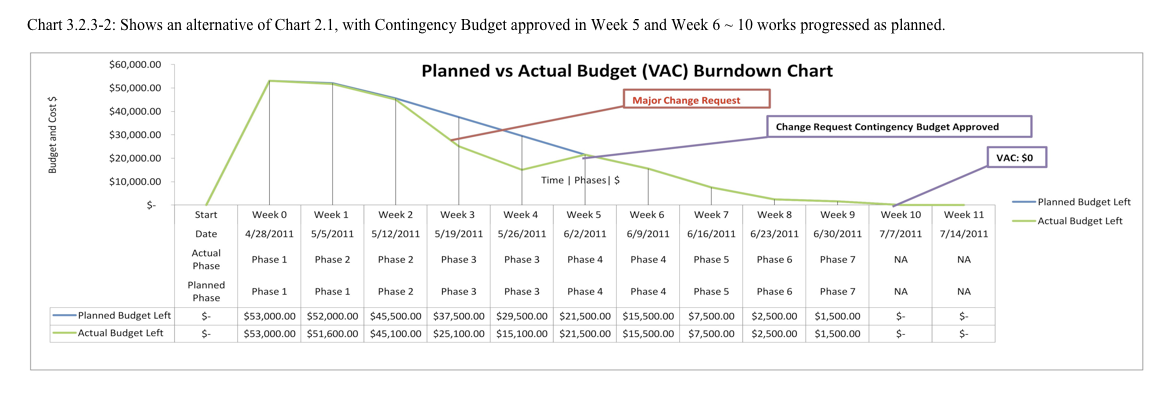
3.2.3 T-EVM Chart 2: Burndown Chart
These non-traditional T-EVM Burndown Charts (Chart 3.2.3-1 and 3.2.3-2) are useful to show VAC and how a fixed budget project is progressing. Burndown chart is a native agile reporting tool, “some people find [the burndown chart] emotionally more powerful” is how Cockburn described the communicative quality of a burndown chart. [8] (Cockburn, 2004) The graph proposed here, while not showing EV, shows VAC through (a) Actual Cost vs Planned Cost and (b) Actual Progress vs Planned Progress. Through adding the row data of “Actual Phase” and “Planned Phase”, this Burndown Chart is able to show how Actual Cost is tracked against Actual Progress, which in principle is an EVM Chart even though it does not show EV explicitly. [13] (Rusk, 2011)
Chart 3.2.3-1:
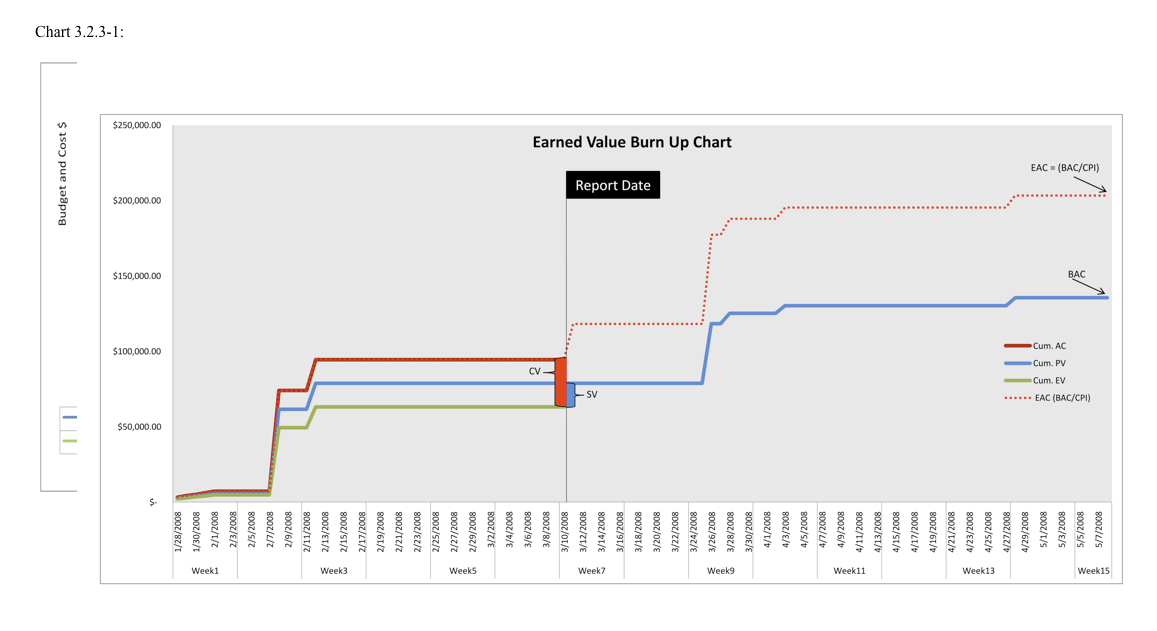
Chart 3.2.3-2: Shows an alternative of Chart 2.1, with Contingency Budget approved in Week 5 and Week 6 ~ 10 works progressed as planned.
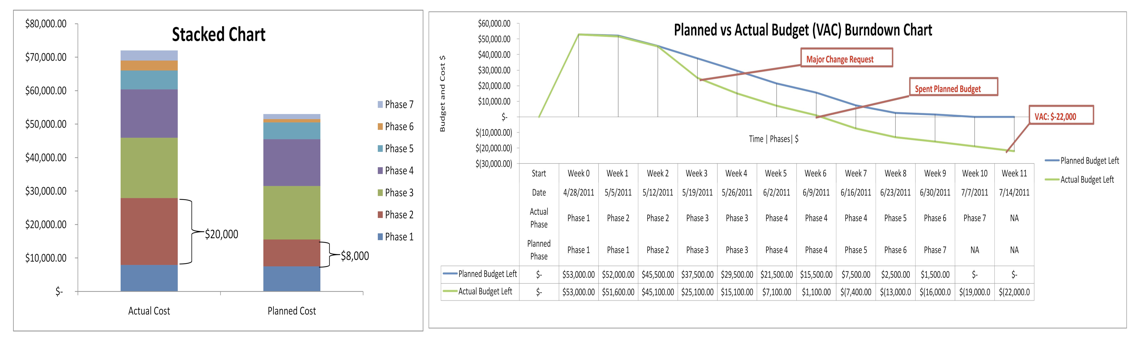
3.2.4 T-EVM Stacked Chart
The final T-EVM Chart to be presented here is a Stacked Chart. In principle, this is similar to Agile’s Release Planning Chart. It can be used as a complimentary chart to T-EVM Burndown Chart and supplement the spending-to-phase ratio to date. In the combination Chart 3.2.4, it is easy to identify that at Phase 2 and between Week 2 -3, there is a large discrepancy between the planned and actual budget, thus deserving immediate management attention.
Chart 3.2.4: (Stacked Chart, complimentary to the T-EVM Burndown Chart 2.1)
4.0 Traditional EVM Mapped to Project Life Cycle and PMI 9 Knowledge Areas
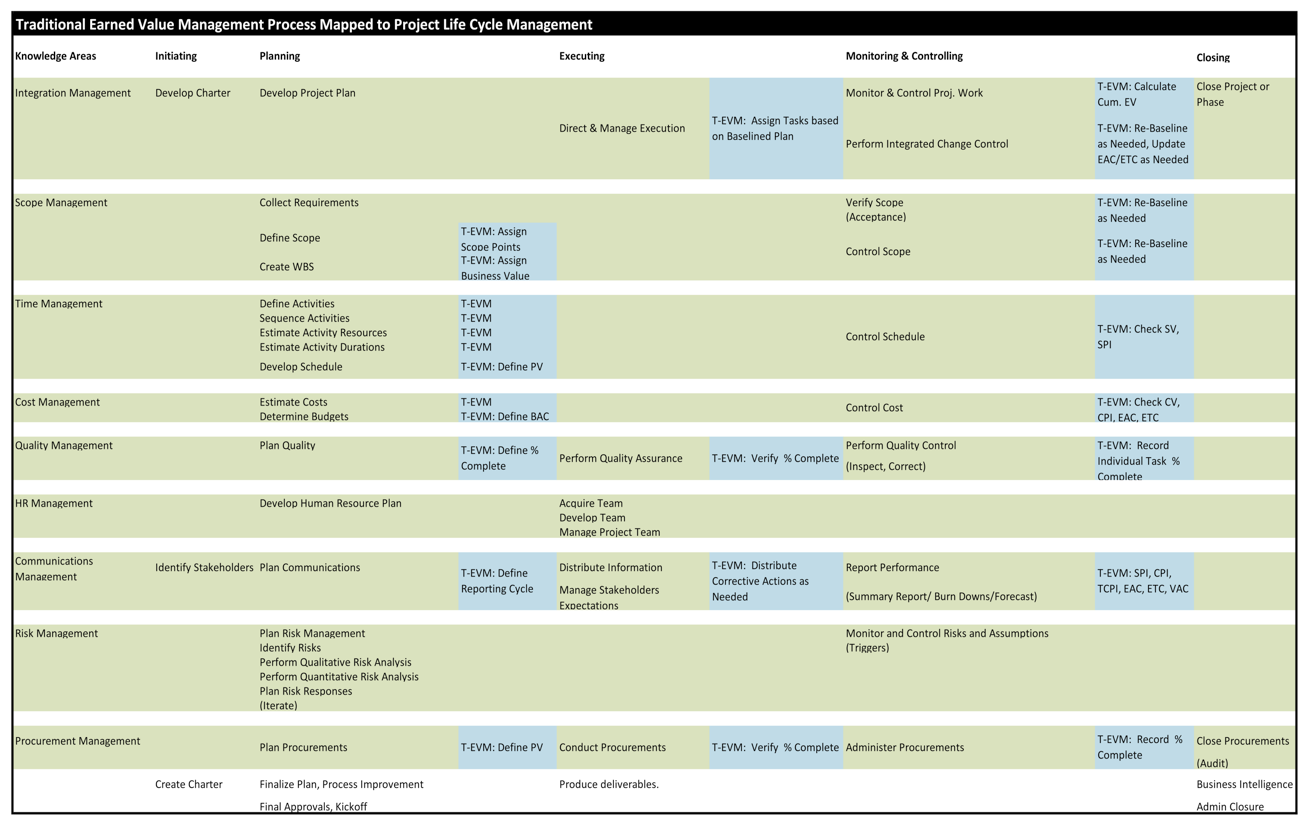
Table 2: [20] (Kanabar & Warburton, 2009).
References
[0] Booker, Garry (2009). Performance Management for All Projects. Project Landscape P3 ~ P5 : PMI Februrary 2009
[1] Rusk, J. (2009).Earned Value for Agile Development. DoD Software Tech News, Vol. 12, No. 1.: Optimation Ltd, The DACS
[2] Glen Alleman, Glen (2011). Agile and EVM? Herding Blog: http://herdingcats.typepad.com/my_weblog/2011/05/agile-and-evm.html
[3] Cabri, A., Griffiths, M. (2006). Earned Value and Agile Reporting: Quadrus Development Inc. Agile 2006 Agile 06 IEEE Pages: P17 ~ 22 ISBN:0769525628
[4] Anbari, F. (2003). Earned Value Project Management Method and Extensions. Project Management Journal; Dec 2003; 34, 4; ABI/INFORM Complete P.12
[5] Rusk, J. (2011) Converting Apples to Orange. AgileKiwi:http://www.agilekiwi.com/earnedvalue/apples-and-oranges/
[6] Sulaiman, Barton, Blackburn,, (2006). AgileEVM – Earned Value Management in Scrum Projects. IEEE: Agile 2006 Conference
[7] Nee, Nancy Y. (2010).Metrics for Agile Projects: Finding the Right Tools for the Job. ESI International White Paper.: www.esi-emea.com
[8] Cockburn A. (2004) Crystal Clear: Chapter 3: Earned-value and burn charts. Addison-Wesley, 2004: http://alistair.cockburn.us/Earned-value+and+burn+charts
[9] Goodpasture, J.C. (2010) Project Management the Agile Way: Making It Work in the Enterprise. Fort Lauderdale: J. Ross Publishing http://books.google.com/books?id=3pBLla6Ypl8C&pg=PA240&dq=earned+value+management+%2B+agile&hl=en&ei=sTDSTaTqJNGtgQegdXvCw&sa=X&oi=book_result&ct=result&resnum=2&sqi=2&ved=0CGkQ6AEwAQ#v=onepage&q=earned%20value%20management%20%2B%20agile&f=false
[10] Rawsthorne, D. (2010). Calculating Earned Business Value for an Agile Project. Collabnet.
[11] Rawsthorne, D. (2010). Monitoring Scrum Projects with AgileEVM and Earned Business Value (EBV) Metrics. Collabnet.
[12] Rusk, J. (2004) Methodology Map. AgileKiwi: http://www.agilekiwi.com/other/agile/methodology-map/
[13] Rusk, J. (2010) Earned Value in a Nutshelle. AgileKiwi:http://www.agilekiwi.com/earnedvalue/earned-value-in-a-nutshell/
[14] Keith, C. (2010), Agile Game Development with Scrum. Addison-Wesley, 2010 ISBN-13 978-0-321-61852-8; ISBN-10: 0-321-61852-1
[15] Tosi, Jennifer Tosi (2008), Forecasting Project Completing Dates based on Velocity. http://alistair.cockburn.us/Burndown+chart+showing+scope+change
[16] Schwaber, K. (2004), Agile Project Management with Scrum. Redmond, Washington: Microsoft Press
[17] Chin, G. (2004) Agile Project Management: How to Succeed in the Face of Changing Project Requirements. New York: AMACOM
[18] Solanki, P. (2009) Earned Value Management: Integrated View of Cost and Schedule Performance. New Delhi: Global India Publications Pvt Ltd. ISBN: 978-93-80228-52-5 (P111) http://books.google.com/books?id=4lmXKNR46tIC&pg=PA111&dq=earned+value+management+%2B+agile&hl=en&ei=sTDSTaTqJNGtgQeg-dXvCw&sa=X&oi=book_result&ct=result&resnum=1&sqi=2&ved=0CGQQ6AEwAA#v=onepage&q=earned%20value%20management%20%2B%20agile&f=false
[19] Larson, E. W., & Gray, C. F. (2011). Project Management: The Managerial Process. New York: McGraw-Hill Companies, Inc.
[20] Kanabar, V. & Warburton, R.D.H. (2009). Adapted from PMBOK 2009. PA. Newtown Sq.