
Agile Earned Value Management Processes
Full research paper could be found by clicking this link below:
http://www.pmroi.com/storage/WuS_TEVMAEVMProcess_20110620-pmroiweb.pdf
Su-Cheng Wu

2.0 Agile and Traditional EVM's Challenge, Common Ground and Differences
2.1 Challenge:
2.1.1: Application of T-EVM to Agile Projects Violates the First Critical Success Factor?
According to Solanki, applying Traditional Earned Value directly to agile projects violates the first success factor of T-EVM, namely “Quality of the project’s baseline plan”. [18] (Solanki, 2009) Due to the iterative scope planning in agile projects, directly applying T-EVM produces invalid Planned Value (PV) and requires cumbersome re-baselines. Without a valid PV, many EVM functions cannot be calculated.
2.1.2: Booker’s “5 Levels to reach Full-Featured EVM for All Projects”
Despite the obvious challenge, the core concepts of Earned Value are clearly shared in both traditional and agile projects. Not only does Agile’s native burn charts correspond well with EVM [18] (Solanki, 2009), Booker, in his “Performance Management for All Projects” outlined how any project can reach full-featured EVM through applying the following 5 levels of management techniques. [0] (Booker, 2009)
- Level -0 Iterative Scope Management
- Level -1 Iterative and Total Scope Management
- Level -2 Integrated Scope and Schedule Management
- Level -3 Integrated Scope Schedule and Cost Management
- Level -4 Integrated Full-Featured EVM
To overcome the challenge in reaching Level-4, Booker advocates that one must “master total scope”, meaning it is critical to assign “Scope Points” collaboratively during Level -0 and -1. Specifically, Scope Points should be used to measure scope and calculate performance, and scope points, schedule, and cost performance should be integrated throughout all levels. This idea of quantifying and sizing scope is fundamental to both traditional and agile earned value.
2.2 Compare and Contrast:
2.2.1 Common ground: Agile vs EVM
As it turns out, there are a lot of similarities between agile and the traditional EVM methodology. Glen Alleman stated the following in his “Agile and EVM?” [2] (Glen, 2011):
- Agile measures physical percent complete, so does EVM. Both need to specify the “definition of done.”
- Agile has bounded scope during iteration, so does EVM through Work Packages and Planning Packages on baseline.
- Agile postpones the details of work that is in the future, so does EVM through Planning Packages.
- Agile manages risk through frequent delivery of working products, so does EVM when using a credible IMS and Integrated Master Plan with Accomplishments and Criteria for each Program Event.
- Agile provides for teams to manage themselves, so does EVM with Control Account and Work Package Managers.
- Agile focuses on deliverables, so does EVM through the WBS terminal nodes.
2.2.2 Differences: Traditional vs Agile Project
In order to use EVM properly for each project type, it is important to understand their differences. According to Cabri and Griffiths, traditional projects and agile projects have the following assumptions: [3] (Cabri and Griffith, 2006)
- Traditional Projects: 1) Project scope can be defined “bottom-up”. 2) Projects works are completed in a linear fashion. 3) Project scope change is minor.
- Agile Projects: 1) Project scope is defined at a high level and iteratively. 2) Project works are completed iteratively, and not linearly. 3) Project scope changes are expected and frequent.
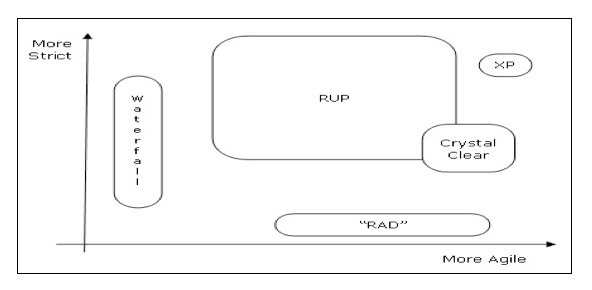
- More differences can be seen in this "Applicability of Agile PM Chart”, proposed in the book “Agile Project Management: How to Succeed in the Face of Changing Project Requirements”: [17] (Chin, 2004)

- Finally, while EVM concepts are applicable in both traditional and agile project types, in order to forecast future performance, T-EVM and A-EVM calculates their Key Performance Index (KPI) with different orientations. [5] (Rusk, 2011), [16] (Solanki, 2009)
- Traditional EVM’s KPI measures the actual cost against the “inputs” of the initially planned scope.
- Agile EVM’s KPI measures the actual cost against the “outputs” of the estimated earned and forecasted progress, iteratively.
5.0 Agile Earned Value Management Process and Tools Overview
3.1 Introduction to Agile
Unlike traditional projects following a linear project life cycle with the majority of their scope known upfront, projects that are unprecedented, heavy in R&D, creative and non-linear in nature would benefit from the Agile Project Management methodology. [3] (Cabri and Griffith, 2006). Most noticeably, agile projects can be seen in platform, process, or software development. [17] (Chin, 2004). Before discussing agile’s earned value management, a quick overview of the agile concepts is outlined below. They clearly show the importance of why Agile EVM must be “light weight”
3.1.1 Agile Manifesto
“We are uncovering better ways of developing software by doing it and helping others do it. Through this work we have come to value:
- Individuals and Interactions over processes and tools
- Working software over comprehensive documentation
- Customer collaboration over contract negotiation
- Responding to change over following a plan
That is, while there is value in items on the right, we value the items on the left more.” [14] (Keith, 2010)
3.1.2 Degrees of “agile-ness” and The requirement of a “light weight” A-EVM Process
John Rusk proposed this subjective Methodology Map, comparing all methodologies’ agile-ness. “Factors leading to higher ‘agility ratings’ included lightness of documentation, ability to handle change, emphasis on people over process etc.” [12] (Rusk, 2004). It is important to note that both Agile Manifesto and John Rusk’s Methodology Map emphasized “lightness” in documentation and processes. This “light weight” requirement is what gives agile methodology the edge to deal with the constantly changing and iterative scopes. Supporting this requirement, in “AgileEVM”, Sulaiman et al. also stated that in order to prove the validity and value of using EVM on scrum (agile) project, any A-EVM process developed must try to derive earned value through as many native agile PKIs and tools as possible. In this way, no unfamiliar metrics or processes are introduced that could cause additional burden to the agile frameworks. [6] (Sulaiman, Barton and Blackburn, 2006).
3.1.3 Agile’s General Roles and Workflow Overview: Using Scrum as an Example
- Product Owner: [14] (Keith, 2010), [16] (Schwaber, 2004)
- Represent the customer and ensure that the team delivers values to the business.
- Responsible in writing customer-centric features, called “User Stories”.
- “User Stories” are written based on the following template: As a <user role>, I want <goal> |so that <reason>|
- User Role: A customer, or a user
- Goal: A feature, or function
- Reason: The benefit to the customer or user. (Optional if it’s obvious).
- “User Stories” can be aggregated into “Epics” and “Themes”.
- Prioritize “User Stories” a.k.a. “Product Backlog Items (PBIs)” into “Product Backlog”.
- Announce “Release Plan” expectation and the “Planned Release Dates”.
- Scrum Master: [14] (Keith, 2010), [16] (Schwaber, 2004)
- In lieu of a project manager, as a servant-leader to facilitate the scrum process.
- Facilitate meetings such as: “Daily Scrum”, “Sprint Planning”, “Sprint Review”, “Sprint Retrospective” and “Release Planning” meetings.
- Provide burn charts, recording the team’s “Velocity”, an agile equivalent of “EV”, or the “earned story points” in Scrum. [11] (Rawsthorne, 2010).
- Responsible, in A-EVM, for deriving agile EVM’s version of CPI, SPI (Mean Velocity), and to calculate “Forecast Release Date (RD)” with “Forecast Release Points”. [15] (Tosi, 2008)
- Inform Product Owner and the Scrum Team of the Release Plan, specifically the baseline and forecast “Release Date” and “Release Points” variance. [6] (Sulaiman, Barton, Blackburn, 2006), [11] (Rawsthorne, 2010) , [8] (Cockburn , 2004)
- Scrum Team: [14] (Keith, 2010), [16] (Schwaber, 2004)
- Multi-disciplined, self managed, cross-functional team.
- Responsible in assigning “Story Points” to “User Stories” through the use of “Planning Poker”.
- “Story Points” are used mainly to measure the size or difficulty of the effort needed to complete each “User Story” or “PBIs”. Initially, the team could use ideal days, but emphasis is placed on how big or how difficult the story is, not on how long the story is. [11] (Rawsthorne, 2010).
- Decide an iteration length of time called “Sprint”, typically it is time-boxed to one to four weeks.
- Decide how many total “Story Points” could be done in each “Sprint” based on the team’s demonstrated “Mean Velocity”.
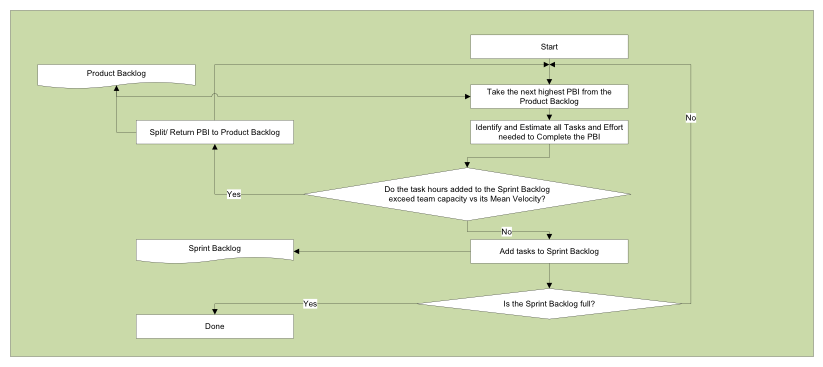
- Decompose the “Product Backlog” into “Sprint Backlog” based on priority, dependencies, resources and “Story Points” of PBIs found in “Product Backlog”. (See “Scrum Sprint Planning Process” in 5.1.3.1 below) [14] (Keith, 2010)
- “Sprint Backlog” is frozen for each Sprint. Scope adjustment is only allowed at the end of each Sprint, by adjusting “Story Points” of PBIs and subsequently updating the scope. (This is agile’s iterative scope adjustment process.)
- Decide how many “Sprints” per “Release Plan”.
- Define “Definition of Done” and the associated Testing and Acceptance Tools/Processes and Criteria.
- “Task Board” is prepared, during each “Sprint” the tasks status are updated from to-do, to in-progress, to done.
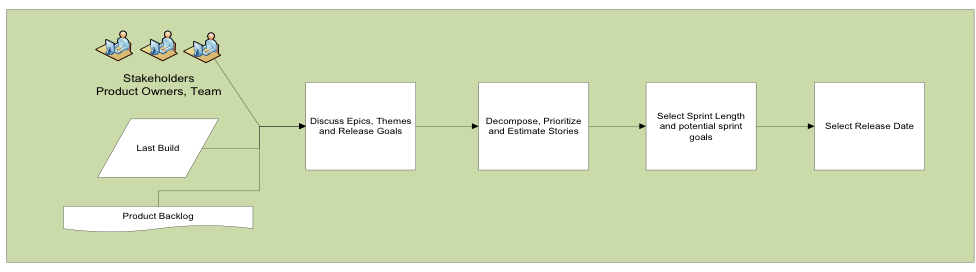
- In “Release Planning Meetings”, all ideal days story points are gathered from multiple “Sprints” to produce “Baseline Release Points”, supplementing the “Release Plan’s Planned Release Dates”. (See “Scrum Release Planning Process” in 5.1.3.2 below) [14] (Keith, 2010)
5.1.3.1 Native Tools: Scrum’s Sprint Planning Process [14] (Keith, 2010)
5.1.2.2 Agile Native Tools: Scrum’s Release Planning Process [14] (Keith, 2010)
3.2 Agile Native Process and Tools Details: Artifacts, Reports, Best Practices and A-EVM Charts
Agile has several types of charts that are “extremely simple and astonishingly powerful. They reveal the strategy being used, show the progress made against predictions, and open the door to discussions about how best to proceed, including the difficult discussions about whether to cut scope or extend the schedule. They have a natural mapping to the earned value charts . . .” [8] Cockburn A. (2004)
3.2.1 Product Backlog and Sprint Backlog
- List all features, provide “User Stories”. List the items as Product Backlog Items (PBIs).
- Best Practice: Mike Cohn and Bill Wake (2003) suggested the following attributes of a good story: [14] (Keith,2010) - INVEST: Independent, Negotiable, Valuable, Estimatable, Sized appropriately, and Testable (Definition of Done)
2. Sort and sequence the work items into a Product Backlog, considering the following list of “Knowledge”: Business Value, Cost, Risk, and Development Dependencies.
- Best Practice: Scrum uses a rapid time-boxed R&D period a.k.a. “Spike” to gain Knowledge of unknown PBIs. [14] (Keith, 2010)
3. Assign Story Points and how much can be accomplished in each iteration or delivery period.
- Best Practice: Scrum Team uses “Planning Poker”, utilizing relative “Story Points” as quantifiable numbers to appropriately “size” the Stories. “Ideal Days” can also be used, but they are still measures of size alone. An one Ideal Day story does not mean it takes one day of actual work to complete, the “Ideal Days” are relative to other stories. Avoid any translation of ideal days to actual days of effort. These are valuable ideal measures for quick relative forecasts of effort but not precise enough to use for making commitments. [14] (Keith, 2010) The reason for using relative estimates instead of absolute numbers is so that if we are 10% over our first set of estimates, the remaining sets of values will scale accordingly. [8] (Cockburn, 2004)
- Best Practice: When decomposing stories into tasks, consider the following story types:
- Goal: Analysis Story, which is done when there’s a validated user scenario
- Main Execution Flow: Development Story, which is done when there are verified tests that pass
- Alternative/Connective Flow: Analysis, Development Story or “Derived Requirement Story”, which is done when alternative flows are identified and action taken.
- Stress-test: Test Story, which is done when there is a validated testing regiment that passes. [10] (Rawsthorne, 2010)
5.2.1.3 “Iceberg List”:
Cockburn calls 5.2.1.3 an “Iceberg List”, where the “above water” part lists all the items that can be delivered in the current delivery cycle. The “below water part” lists other delivery cycles. The name “Iceberg List” indicates that there is a fixed Total Budgeted Story Points allowed in each Release or Sprint Plan; when a new item (PBI) is added to the “above water” part, it pushes every other PBIs down. In Scrum terminology, the “above water part” is the “Sprint Backlog” and the “below water part” is the “Product Backlog”. [8] (Cockburn, 2004) Moreover, Rawsthorne’s Business Value is also incorporated here with the Iceberg Lis. Sorting the Iceberg List using business values can ensure the highest ROI being delivered in the time spent.
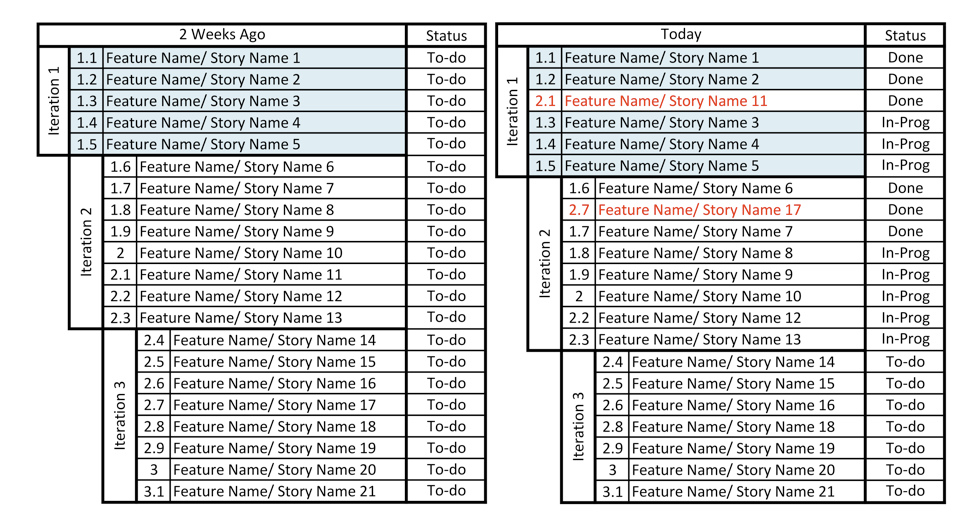
5.2.1.4 Iteration Status Chart:
Nee calls 5.2.1.4 an “Iteration Status Chart”, designed to show stakeholders from one iteration to the next. [7] (Nee, 2010) With modification, this could supplement the Iceberg List, so long as the total Story Points for each Iteration remains within the Team’s demonstrated average Velocity.
3.2.2 Agile Burn Up Chart
The Agile Burn Up Chart shows progress and earned value. [8] (Cockburn, 2004)
Advantages:
- It shows both the status and the rate of progress (“Velocity”).
- In % or absolute numbers, the vertical axis can show Planned vs Actual Story Points Earned (Ideal Days) or even Business Values.
Disadvantage: The graph track “rate” and “trend” nicely, but “progress” could be misleading due to Agile Project’s iterative Scope.
Two solutions were proposed:
- When possible, choose a unit of measure that cannot expand. For example, the defined numbers of User Modules or Game Levels.
- Be prepared to mark the “changing ceiling” of the Scope to show the incremental increase of the Scope. Because this does not resolve the “Unknown Time” problem, A-EVM’s Release Date Forecast index and Mean Velocity can be used to forecast Release Date.

3.2.3 Rusk’s Light-Weight Agile EVM Chart (Agile Burn Up Chart continued)
In accordance to agile’s requirement for a light-weight A-EVM process, adding Cost % to the Agile Burn Up Chart, as suggested by Rusk, creates a chart similar to the T-EVM Burn Up Chart while at the same time allowing the viewer to quickly derive EVM Metrics visually without having to perform the actual EVM calculations. [1] (Rusk, 2009) The example Agile EVM Chart below shows intuitive A-EVM CPI and SPI on the reporting date: a) Cost over-run = 50%, b) Earned Value = 50% slower than expected.
Advantages:
- No EVM or Agile acronyms, which translates into better communication with stakeholders, especially Sr. Management.
- Adding ’budget burn %” (AC) conveys considerable more information than a standard burn chat, making this a light weight A-EVM chart.
Assumptions:
- Simplified the distribution of PV over time, which is in accordance with agile’s time-boxed and Iceberg List Spring Planning practice.
- Cost and Progress are reported at the project level, not at task, sub-phases, sprint, or releases level.
- Agile’s earning rule is strictly reinforced. Task performed does not “earn” any value, only features delivered counts.
- Rusk suggests showing this chart every 3 to 6 months for a “big picture” view that still gives enough warning to take corrective actions.

3.2.4 Agile Burndown Chart
“The Agile Burndown Chart is emotionally powerful because there is a special feeling about hitting the number zero that helps people gets excited about completing their work and pressing forward.” It presents similar agile earned value information as the Agile Burn Up Chart but focuses in on the end-goal.
Best Practice: [8] (Cockburn, 2004), [3] (Cabri and Griffiths, 2006).
- Scope change should only happen “after” each iteration has completed. This allows the team to focus on the committed features during the time-boxed iteration. Using A-EVM concepts, the team’s “Mean Velocity” can be used to forecast future release dates.
- Consider showing scope change in the Burndown Chart below. The amount and frequency of the scope change is valuable information.

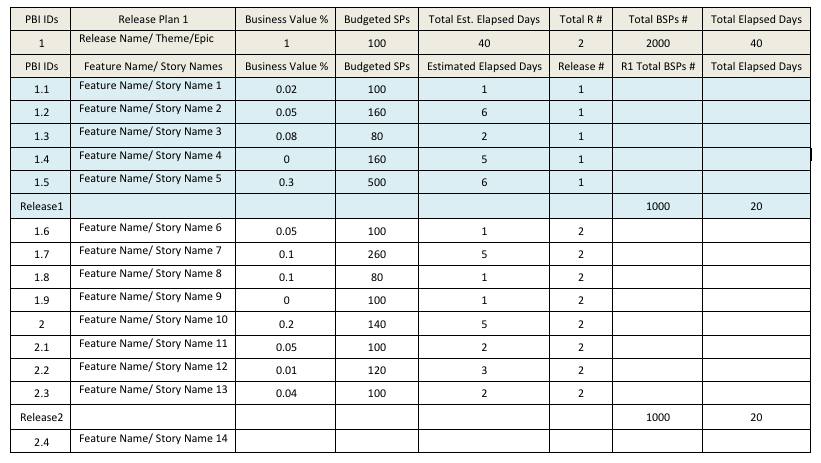
3.2.5 Release Plan Stacked Chart
Once Story Points, resource, Sprint Length and numbers or Sprints are established, a Release Plan can be established and shown via a Release Plan Stacked Chart.
Best Practice: [11] (Rawsthorne, 2010).
- In the Release Plan, suggest adding a feature or PBI called “Chores” that represents all the work that has to be done that doesn’t produce any Business Value. These activities may include building team infrastructure, training, and analysis including any “Derived Requirements” that are identified after detailed decomposition of the initial “User Requirements” found in “User Stories”.
- In an ideal world, Chores may consist of roughly 1/3 of the total budget, useful to establish a “Baseline Velocity” for A-EVM calculations.
- Although Chores don’t offer Business Value, they do have Story Points Value that is useful in calculating teams’ “Actual Mean Velocity”.
- Two Release Plan Staked Charts were shown below, an Ideal Baseline and a Challenged Actual.

3.3 Agile Earned Value Management (A-EVM) Application
3.3.1 A-EVM benefit, assumptions and key success criteria
In most Agile approaches, teams use some variant of the daily meeting to track progress, issues, risks and challenges that arise, answering three simple questions: What have you done since the last meeting? What will you do until the next meeting? What issues, risks, or barriers have arisen that could distract you from accomplishing the iteration goals? While Agile Project native reports a) focus on results and flexibility b) are proven to be highly effective in scope management, to the non-agile practitioner, including Sr. Management, most agile reports do not answer stakeholder questions such as costs and resources consumed and the rigorous forecast that traditional Earned Value metrics like EAC (Estimate at Completion) or ETC (Estimate to Completion) provide. [7] (Nee, 2010). In 2006, Sulaiman, Barton, and Blackburn’s “AgileEVM” established that Scrum’s “Mean Velocity” and T-EVM’s “Estimate at Completion” can derive the same “Forecast Release Date”, thus mathematically proving the validity of applying EVM functions to Agile projects with modifications. Different A-EVM researchers and experts established the following A-EVM assumptions and key success criteria:
- A-EVM uses “Earned” Story Points (or “shippable deliveries”), measuring integrated works rather than tasks performed.
- A-EVM requires a baseline like traditional EVM, a “Product Backlog” with “Story Points” assigned to “PBIs” would suffice.
- In order to forecast “Release Date (RD)”, A-EVM assumes “Sprint Length (L)” (Iteration Time) is constant between all “Sprints”.
- A-EVM measures progress at the end of each “Sprint” when accurate “Sprint Velocity” and “Actual Costs” are known.
- Change control is managed and reviewed at the end of each “Sprint”. “Story Points” are added/ subtracted. Re-baseline if needed.
- Similar to T-EVM, as stated in section 3.1.3 of this paper, in order to calculate earned value or to forecast objectively, there must be an accurate representation of actual and planned percent complete.
To date, different researchers offered slightly different sets of Agile EVM Metrics and Equations based on different assumptions, acronyms, and A-EVM application logic. In the tables below, this paper will add “Value Type” while presenting each A-EVM Metrics and Equation Table; starting with Sulaiman et al’s, then Nee & ESI Internation’s and finally Rawsthornes’. [6] (Sulaiman, Barton, and Blackburn, 2006), [7] (Nee, 2010), [11] (Rawsthorne, 2010)
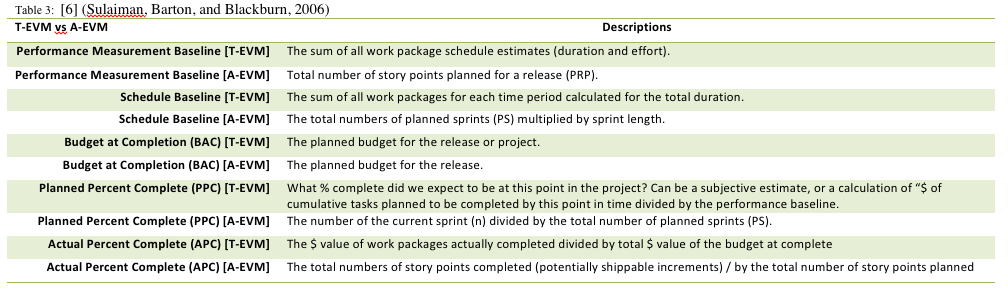
3.3.2 Sulaiman et al.’s AgileEVM: Comparison of Earned Value Management Terms:
Table 3: [6] (Sulaiman, Barton, and Blackburn, 2006)
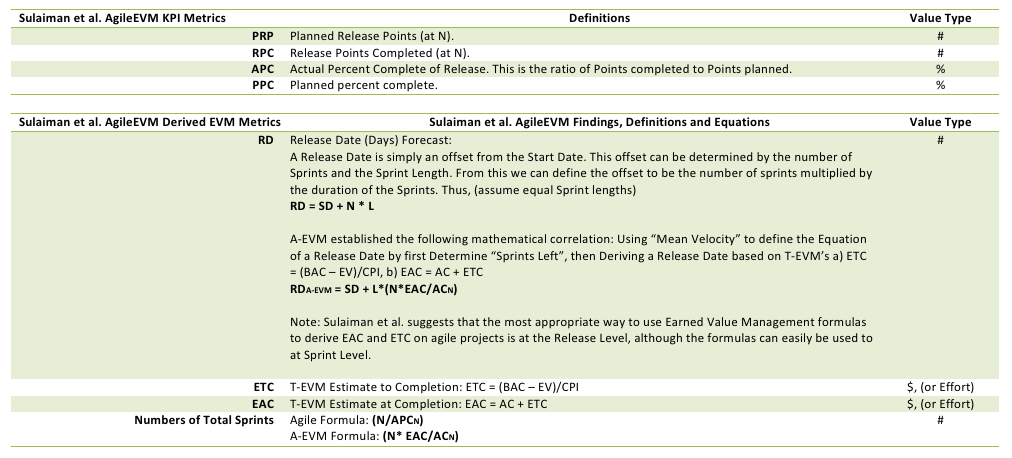
3.3.3 Sulaiman et al.’s AgileEVM Metrics, Definition and Equation Summary
Table 4: [6] (Sulaiman, Barton, and Blackburn, 2006)

Table 4 (continued): [6] (Sulaiman, Barton, and Blackburn, 2006)
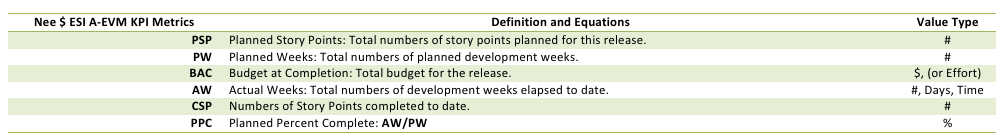
3.3.4 Nee and ESI International’s A-EVM Metrics, Definition and Equation Summary
Table 5: [7] (Nee, 2010)

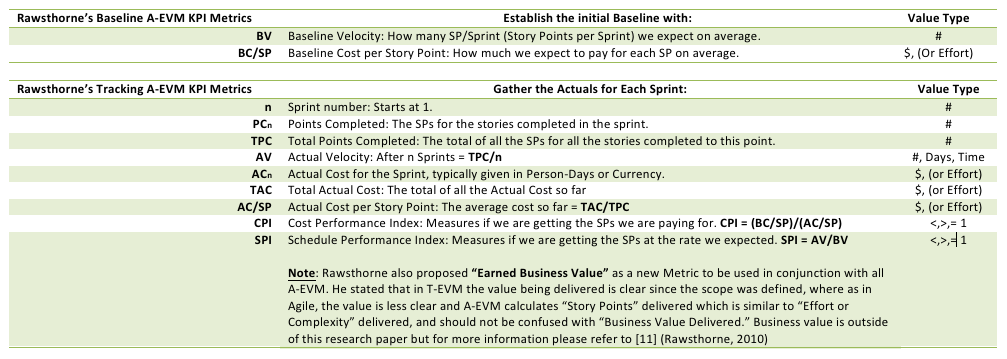
3.3.5 Rawsthorne’s A-EVM Metrics, Definition and Equation Summary
Table 6: [11] (Rawsthorne, 2010)
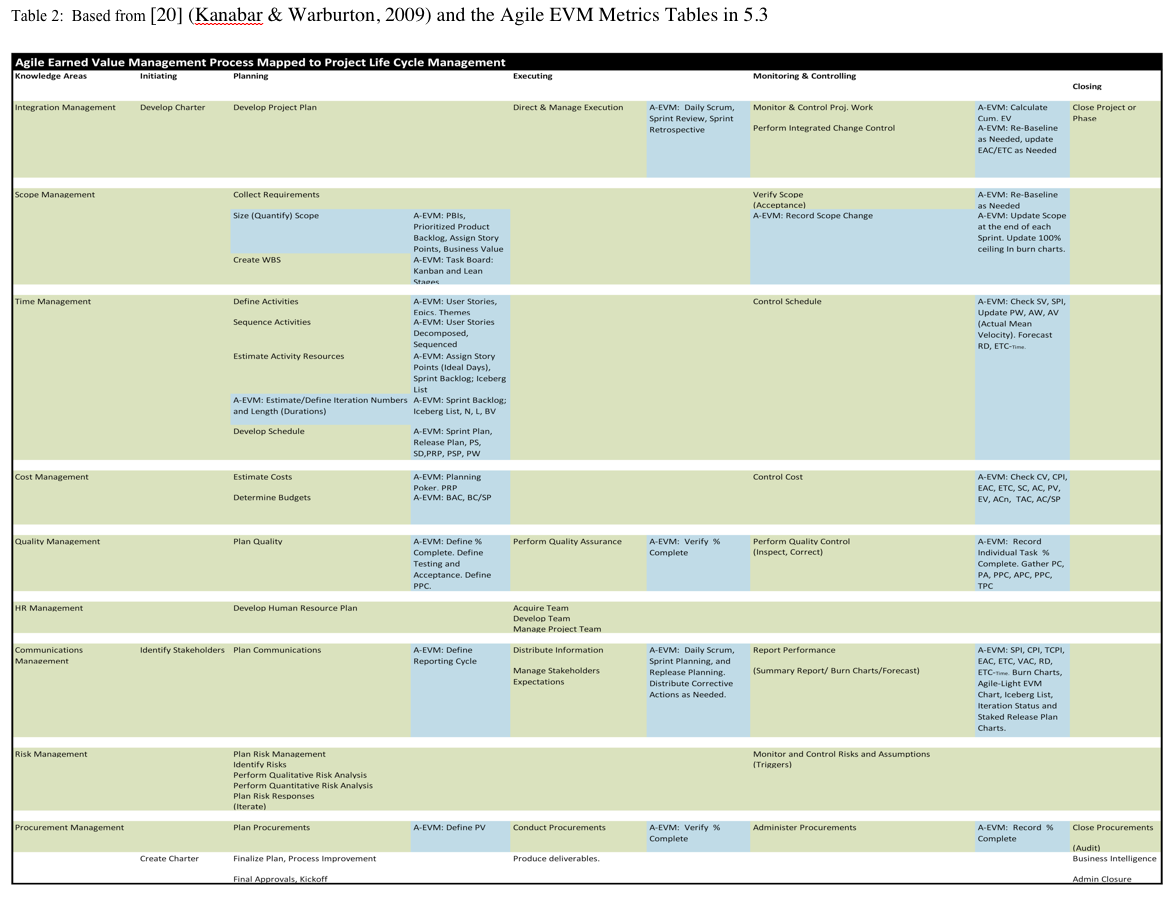
6.0 Agile EVM Mapped to Project Life Cycle and PMI 9 Knowledge Areas
Table 2: Based from [20] (Kanabar & Warburton, 2009) and the Agile EVM Metrics Tables in 5.3
References
[0] Booker, Garry (2009). Performance Management for All Projects. Project Landscape P3 ~ P5 : PMI Februrary 2009
[1] Rusk, J. (2009).Earned Value for Agile Development. DoD Software Tech News, Vol. 12, No. 1.: Optimation Ltd, The DACS
[2] Glen Alleman, Glen (2011). Agile and EVM? Herding Blog: http://herdingcats.typepad.com/my_weblog/2011/05/agile-and-evm.html
[3] Cabri, A., Griffiths, M. (2006). Earned Value and Agile Reporting: Quadrus Development Inc. Agile 2006 Agile 06 IEEE Pages: P17 ~ 22 ISBN:0769525628
[4] Anbari, F. (2003). Earned Value Project Management Method and Extensions. Project Management Journal; Dec 2003; 34, 4; ABI/INFORM Complete P.12
[5] Rusk, J. (2011) Converting Apples to Orange. AgileKiwi:http://www.agilekiwi.com/earnedvalue/apples-and-oranges/
[6] Sulaiman, Barton, Blackburn,, (2006). AgileEVM – Earned Value Management in Scrum Projects. IEEE: Agile 2006 Conference
[7] Nee, Nancy Y. (2010).Metrics for Agile Projects: Finding the Right Tools for the Job. ESI International White Paper.: www.esi-emea.com
[8] Cockburn A. (2004) Crystal Clear: Chapter 3: Earned-value and burn charts. Addison-Wesley, 2004: http://alistair.cockburn.us/Earned-value+and+burn+charts
[9] Goodpasture, J.C. (2010) Project Management the Agile Way: Making It Work in the Enterprise. Fort Lauderdale: J. Ross Publishing http://books.google.com/books?id=3pBLla6Ypl8C&pg=PA240&dq=earned+value+management+%2B+agile&hl=en&ei=sTDSTaTqJNGtgQegdXvCw&sa=X&oi=book_result&ct=result&resnum=2&sqi=2&ved=0CGkQ6AEwAQ#v=onepage&q=earned%20value%20management%20%2B%20agile&f=false
[10] Rawsthorne, D. (2010). Calculating Earned Business Value for an Agile Project. Collabnet.
[11] Rawsthorne, D. (2010). Monitoring Scrum Projects with AgileEVM and Earned Business Value (EBV) Metrics. Collabnet.
[12] Rusk, J. (2004) Methodology Map. AgileKiwi: http://www.agilekiwi.com/other/agile/methodology-map/
[13] Rusk, J. (2010) Earned Value in a Nutshelle. AgileKiwi:http://www.agilekiwi.com/earnedvalue/earned-value-in-a-nutshell/
[14] Keith, C. (2010), Agile Game Development with Scrum. Addison-Wesley, 2010 ISBN-13 978-0-321-61852-8; ISBN-10: 0-321-61852-1
[15] Tosi, Jennifer Tosi (2008), Forecasting Project Completing Dates based on Velocity. http://alistair.cockburn.us/Burndown+chart+showing+scope+change
[16] Schwaber, K. (2004), Agile Project Management with Scrum. Redmond, Washington: Microsoft Press
[17] Chin, G. (2004) Agile Project Management: How to Succeed in the Face of Changing Project Requirements. New York: AMACOM
[18] Solanki, P. (2009) Earned Value Management: Integrated View of Cost and Schedule Performance. New Delhi: Global India Publications Pvt Ltd. ISBN: 978-93-80228-52-5 (P111) http://books.google.com/books?id=4lmXKNR46tIC&pg=PA111&dq=earned+value+management+%2B+agile&hl=en&ei=sTDSTaTqJNGtgQeg-dXvCw&sa=X&oi=book_result&ct=result&resnum=1&sqi=2&ved=0CGQQ6AEwAA#v=onepage&q=earned%20value%20management%20%2B%20agile&f=false
[19] Larson, E. W., & Gray, C. F. (2011). Project Management: The Managerial Process. New York: McGraw-Hill Companies, Inc.
[20] Kanabar, V. & Warburton, R.D.H. (2009). Adapted from PMBOK 2009. PA. Newtown Sq.